
Characterizing LDOs: Part 1
This is Part 1 of 3 parts.
Part 2 of this article is located here.
Part 3 of this article is located here.
LDOs might seem to be interchangeable. And in many circuits they are. But when you are chasing the last few dB of performance in a 24-bit DAC or ADC, the LDO selection can matter a lot because the LDO is ultimately the reference to the ADC or DAC. In this post, there are 4 LDOs and 1 DCDC compared. The 4 LDOs range from a super cheap $0.08 MIC5504 to the very expensive LT3042 which runs around $3 in large quantities.
Characterization near DC
We’ll start by looking at the near-DC performance of the LDOs. For all the tests here, the load was modest: A 3.3V regulator output with a 470 ohm load resistor, which means about 7 mA. For characterization near DC, we’ll use the QA350 microvolt meter. The QA350 delivers microvolt resolution and quickly generates statistics and graphs on the measurement. The ADS1256 ADC used in the QA350 is a 24-bit ADC, and can deliver about 23 bits of performance, which is rare (and exceptionally good) for 24-bit ADCs. Most 24-bit audio ADCs are delivering around 20 or 21 bits or so of resolution. The remaining bits are noise.
The ADS1256 achieves this performance at the expense of sample rate. At the highest resolution setting, the ADS1256 can deliver about 2.5 samples per second. The plot below is from the ADS1256 spec. The 3 dB point is roughly 1 Hz. And note there are deep notches at both 50 and 60 Hz to eliminate any errant readings due to powerline interference. This response is the desirable byproduct of the averaging performed by the part.

LDO Noise Measurements
Opamps generally specify noise in several regions. From near DC to 10 Hz or so (depending on process technology), the noise is commonly called 1/f or flicker noise. Beyond that, the noise is more broadband in nature. The precise frequency of transition between 1/f noise and broadband noise depends on a variety of factors. But all semiconductor processes will have these two regions to consider.
While opamps and references usually do publish noise numbers for each region, LDOs don’t usually specify the performance in the 1/f region. Below we see the spec on a premium voltage reference (not an LDO). Here you can see that Maxim has specified the noise voltage in the region 0.1 to 10 Hz (the 1/f region), and also the broadband noise region beyond that. Because the broadband noise region is essentially flat, a single figure can be used to describe that region. And you can roughly convert to the bandwidth of interest by multiplying the spectral density figure by the square root of the bandwidth.

A typical LDO, such as the LP295 spec shown below, doesn’t consider low-noise performance at all. All the way up to 300 Hz, you are in uncharted territory in terms of noise. If you want to use an LDO for a precision reference and figure you can just put a big cap on the output and call it good, that is a bad idea. You will be disappointed because the noise is coming from the LDO reference itself: It cannot be knocked down by a cap.

The QA350 doesn’t generate a spectrum plot. But it does build a histogram of readings and given its 1 Hz bandwidth, that can serve as a proxy for the 1/f noise. In the next post we’ll look at the broadband noise in the audio region on these LDOs.
QA350 Measuring an External Reference
With the QA350 and an external voltage reference both warmed up (we’re using a 10V reference from VoltageStandard.com), we can see the following stats displayed below.

Note we can readily see the mean (10.000 006V) and standard deviation from the external source in the top window. The lower right window shows a histogram, which is exceptionally tight (one standard deviation of 6.85uV), and the lower left window shows the voltage over time, with each horizontal line representing a 10 PPM deviation. The statistics in the top window and lower right window were collected over the last 100 samples. The time series in the lower left window was collected over 972 seconds as indicated in the title.
Roughly, we can see the internal reference of the QA350 and the external 10V reference are tracking exceptionally well. There is perhaps +/- 2 PPM of “wandering” between the two. This is conveyed by the flatness of the line in the lower left window.
To see that life isn’t always so wonderful, let’s connect the QA350 input to the 3.3V output of a DCDC converter (LM3670 with a 22uF output filter cap).

Above, we can see the voltage wandering roughly +/- 60 PPM over 2 minutes or so. The standard deviation of the measurements is quite large at roughly 160 uV.
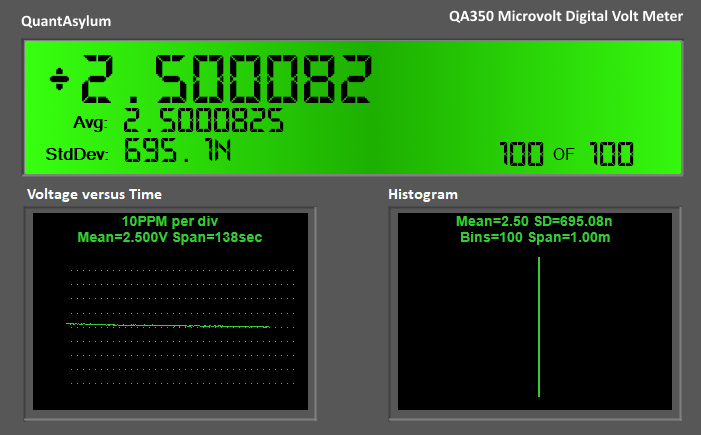
The built-in reference of the QA350 is compared next. Note this reference isn’t used as the reference for the ADC (it has its own MAX6126), but instead this is a dedicated high-quality reference (another MAX6126A, which is rated for +/- 200 PPM) to permit you to calibrate and “sanity check” things if you don’t have a high quality lab reference available. For this test, we calibrated the QA350 against the 10V external reference, which should deliver an overall accuracy of roughly +/- 30 PPM.
Note in the plot below, the QA350 internal 2.5V reference is measuring about 1.1 mV over the expected value of 2.500 000. The spec on the MAX2126A 2.5V is +/- 0.02%, which means we might expect the 2.5V to be anywhere from 2.5V +/- 500uV. However, there are other sources of error. And the larger source of error you will likely encounter at these levels are galvanic in nature: A phantom voltage generated anytime two dissimilar metals are brought into contact with each other with a temperature gradient present.
With a BNC cable we measure:

And with a scope probe making the BNC to BNC connection we measure more than 1 mV less, which means somewhere in the BNC cable there are likely some dissimilar metals generating the offset:

Welcome to the world of precise voltage measurements, where connectors are a big source of error and yes, gold plating matters. The key for this study is to not get too hung up on absolute measurements, but instead focus on low-frequency deviations from each voltage source.
What we’ve seen above is that the QA350 delivers very solid tracking relative to an external reference at a fairly constant temperature. The QA350 can deliver about +/- 1 PPM of stability overall when in a room with little air movement.
Onto the LDOs!
First up is the MIC5504. This is an exceptionally cheap LDO from Microchip and would normally be an outstanding choice for powering a digital circuit or a non-critical analog application.

Next is the LP2985. Note the wandering is much tighter than the MIC5504.

Next is the LM5907. This has a standard deviation even worse than the MIC5504, but you’ll see later in the audio band measurements it’s quite good.

Finally, we get to the last LDO, the super-premium and exotic LT3042:

From the plot above, it doesn’t look the least bit special. But wait, because when we start to look across the audio spectrum, the value of this LDO will become clear.
Summary
Thus far, we can make the following generalizations:
The DCDC converter is all over the place. It’s horrid compared to the cheapest of LDOs. It would be borderline to use this as a source for the ADC reference on a 12-bit ADC.
The dedicated voltages references are phenomenal, and readily distinguishable from even the most esoteric LDO. In fact, the MAX6126 can source/sink 10 mA of current, which likely makes it the better choice for a DAC or ADC reference than even the LM5907.
Graphically, we have the following:

In the case of an opamp, the PSRR of the opamp can clean up the output significantly. But there is little protection from this noise in ADC and DACs, where the output is directly proportional to the provided reference voltage. If we consider the case of a 12-bit ADC with a 3.3V reference, one LSbit is about 800uV. The LM3670 performance above would likely be very close to impacting even a 12-bit converter. And all of the LDOs above would be a problem for a 16-bit converter for measurements at or near DC.
In part 2 of this study, we'll look at the performance of each LDO from 20 to 100 KHz.
This is Part 1 of 3 parts.
Part 2 of this article is located here.
Part 3 of this article is located here.
Discuss this post in the forum
If you liked the post you just read, please consider signing up for our mailing list at the bottom of the page.