
First Look: Evaluating Class D Power Amps with the QA401
Texas Instruments has been in the Class D power amp business for a while. And it shows. Like most tech, Class D first arrived as a solution in search of a problem and early efforts kicked around for decades waiting for the underlying silicon capabilities to catch up. But once it did, the days of other Class-whatever amps were numbered as nothing could compete with the cost and efficiency of Class D. For the last two decades, Class D amps have dominated in portable audio and PC sound–not exactly hifi. But for more than a decade, Class D has been winning sockets in home audio 5.1 and 7.1 amplifiers thanks to its compact size, high efficiency and low cost.
A while back, we took a look at a Class D amp based on the TDA7492. This part is typical of class D in that it boasts impressive power in a small size and this part secured plenty of design wins in a range of cost-sensitive applications. And it was reasonable from a distortion perspective—about 0.05%. Note that the TDA7492 was an open loop amplifier. This means that the amplifier generated pulses blindly, assuming that a wider pulse would cause a higher current to flow and a larger voltage to be induced in the load. And that is a very reasonable assumption. But there is a distortion penalty that comes from this blind trust, that is, as your output pulses get wider, your supply rails might sag a little more which means that the voltage you are inducing isn’t quite as big as you thought it would be. On a data sheet, this manifests in the PSRR and distortion spec. Open-loop Class D are miserable in this regard.
The solution here is to close the loop. High loop gain combined with feedback is how you reduce distortion. About 5 years ago, the first closed-loop Class D chipsets started to appear. The TPA3251 is TI’s latest entry into this space. This part can generate up to 350W mono or 175W stereo into loads with distortion levels that are an order of magnitude better than open-loop. It’s a big step forward.
And TI makes an EVM for the TPA3251, which means it’s easy to measure a well-designed modern high-power class D amp with the QA401. In this post, we’ll do just that by taking a look at some 1 KHz distortion figures and noise figures on the EVM and compare those to the spec sheet.
Test Setup
The test setup consists of a 150W Rigol power supply, the EVM, some load resistors and the QA401 and a laptop. The supply can deliver 33V at 5A, which is a few volts short of the 36V capability of the TPA3251. The test loads were purely resistive, and immersed in a jar of water to help with cooling.
Two scope probes in 1X mode were used to go from the load to the input of the QA401. The ground clips were unconnected, as this gave the best measurements. Note that the QA401 is isolated, in that there is no electrical path from the PC to the QA401’s measurement section.
Noise Measurement
We’ll start with a noise measurements. Class D amplifiers are notorious for being difficult to measure, primarily because there is so much happening on the outputs, even when no sound is being played. Below you can see the TPA3251 spec in BTL, which is the mode we used for all of our measurements.

TI indicates a typical figure of 62 uV is achieved when using A weighting and an AES17 filter. An AES17 filter is designed to reject out of band energy that is common in class D amplifiers. These filters are generally flat to 20 KHz, and then transition to 60 dB of suppression at 24 KHz. This is a very sharp brick-wall transition that can only be fulfilled by a very high order filter (60 dB from 20 to 24 KHz suggests a ~15 to 20th order filter depending on ripple). The purpose of this filter is to ensure that class D hash doesn’t make its way into the test equipment and alias back around into the band of interest. If this happens, there’s no way it can be filtered out because it’s indistinguishable from the in-band noise at that point.
TI has an app note (link below) on using a simple RC filter for power amp measurements, and something similar might be considered in the future for study.

For now, the measurements were made going straight into the QA401. In the plot below, our measurement bandwidth is from 20 to 20KHz, A- Weighting is applied, and we can see the resulting RMS figure is 88.5 uV in 20 to 20 KHz bandwidth. Note that TI’s typical figure on the chipset was 62 uV. So there is a slight discrepancy here that could be due to the fact that the EVM isn’t quite meeting the chipset spec, or that the published “typical” figure was worse on this particular device, or that the QA401 was seeing a slightly higher than expected noise floor due to insufficient filtering prior to the QA401.

THD+N
Next, we take a look at THD+N. TI specs the figure at 1W and also at the power limits of the amp. First, we take a look at the 1W figure into 3 ohms.

In the figure above, we’ve indicated to the QA401 that the load impedance is 3 ohms, which allows the QA401 to display the measured power (shown at 1.05W). The output of the QA401 was adjusted to achieve the desired power, and you can see that the output was –20.8 dBV, and the measured input was 5 dBV, indicating the EVM has a gain of 25.8 dB. We can also see the THD+N figure is 0.00735%. For their THD+N measurements, TI are again using the AES17 brickwall filter, and also an AUX-0025 filter. The AUX-0025 filter is a purely passive filter used for amp testing. It has a more gentle roll-off, delivering about 50 dB rejection at 250 KHz, which means this is roughly a 3rd order passive filter. In short, TI has spec’d this with a lot of filtering beyond 20 KHz.
In the data sheet section below, you can see TI has spec’d the BTL config to hit 0.005% TDH+N at 1 W. The figure measured above (0.00735%) is very close to that number. TI’s measurements were made into 4 ohms, and the plot above was into 3 ohms.

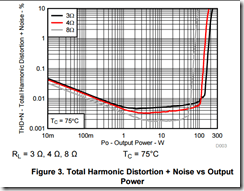
TI has some more detailed THD+N plots in the spec. Figure 3, shown below, shows that the THD+N figure is slightly worse for 3 ohms versus 4 ohms, so we’d in fact expect the published 0.005% figure (into 4 ohms) noted above to be slightly better than the measured 3 ohm figure (0.00735).

THD+N @ 20W into 3 ohms
At 20W, we see a slight improvement to THD+N, just as the figure 3 plot suggests. The measured figure drops to –83.4dB/0.00674%.

Again referring to figure 3, TI shows in Figure 3 that 20W into 3 ohms should be 0.0055%, which agrees very well with the measurement above.
THD+N @ 75W into 3 ohms
At 75W, the THD+N rose to –79.0 dB/0.01126%, while Figure 3 suggests this should be 0.008%. Note, though, that Figure 3 was running from a 36V rail while our measurements were at a 33V rail. This suggests we’d be further up the clipping curve sooner, and thus the measured figure is reasonable and expected.

System Limits
A few final measurements were made with a 3 ohm load while bumping up against the limits of the Rigol power supply. In the plot below, the QA401 was driving at 0 dBV into the TI EVM, the EVM output was at 124W into 3 ohms. It didn’t take long for the load resistor to start boiling water. At this point, the “clip” LED was illuminating.
The power supply was reporting 139.73W, and with 124W being delivered into the load, this is 88% efficiency.

Figure 3 in the TPA3251 spec suggests THD+N at 125W into 3 ohms would be around 0.01% when running from 36V. This setup was limited to 33V, which is consistent with TI’s results in that you’d expect the distortion curve to shift slightly based on the reduced rails.

A load resistor was changed out to 2 ohms, and another measurement made. Here we see the total EVM gain is about 22.18 dB, so the amp has moved further into compression/clipping. And as expected, the distortion has climbed to –67.9/0.0403%. But if the supply had some more capability, you can bet the 2 ohm load would have permitted power levels to reach the chipset max.
With a 26 dBV input limit on the QA401, this is 19.95Vrms, and into 2 ohms this would be 200W. In other words, the QA401 should be able to measure up to 200W into a 2 ohm load, 100W into a 4 ohm load and 50W into an 8 ohm load.

Summary
The QA401 proved incredibly useful in measuring the basic performance of a modern high-power class D amplifier–measurements that couldn’t be made using a sound card. The tests showed that:
- The QA401 input stage could readily handle the demands of high-power class D and displayed solid immunity to the harsh electrical environment associated with class D.
- In spite of NOT having any of the (expensive) filters used in the TI measurements, the QA401 agreed very well with the published TI figures.
- Several accidental settings during testing subject the QA401 to very high amplitudes with the input attenuator disabled. The overload protection of the QA401 operated as expected without any adverse consequences.
- The QA401 measurement capability (noise, THD, THD+N, etc) is substantially better than the best power amplifiers out there. If you need to measure amp performance, the QA401 will not limit you.
- The isolation of the QA401 delivered phenomenal results by demonstrating zero pickup of stray 60 Hz or other unwanted signals, especially in the noise measurements. This was achieved on an open chassis EVM running a few hundred cm away from the QA401.
6-May-2016: This article was updated to unify the plots sizes, units and scales.