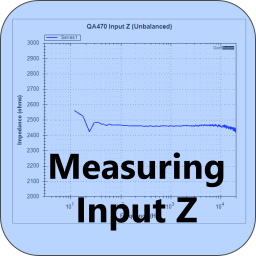
Measuring Input Impedance
Share
For some circuits, it's easy to determine the input impedance. For example, take a look at the simplified input stage of the QA460 Transducer driver. This circuit provides 10X gain and is AC coupled.

We can see the input impedance is about 10K, and from that we can see the low-pass corner is formed by the 22uF and the 10K input impedance. That gives a corner frequency of Fc = 1/(2PIRC) = 1/(2PI(10K)(22uF) = 0.7 Hz.
Many circuits like the one above can be readily inspected and their input Z learned quickly through simple analysis.
But take a look at the XLR input of the QA470 (again, simplified):

This is a bit trickier. The input 100K shunts are to bleed down the phantom power rails so that it doesn't remain impressed forever on the 22uF input caps when the phantom supply is turned off. And they are huge, so we can likely ignore those. We see when phantom is enabled, there's a 6.8K shunt present. The input 300 pF at 20 kHz are about 26K ohms. We might be able to ignore those.
The biggest contributors to the input circuit above are the 22uF series input and the 4.22K shunts. We might take swag that with phantom on, the input Z is is about 4.22K || 6.8K, or about 2.6K. At the low end, we'd expect to see a corner from the input C around 1.7 Hz, and the 390pF will come into play around 20K or so.
But we can sweep it with the QA401 in less time that it takes to set things up in Spice.
For this, we'll use the speaker plug-in named "SPKR Impedance." The speaker plug-in setup looks as follows (see the Help menu item in the plug-in).

Notice what is happening in the diagram above: The QA401 is driving into an unknown load (the speaker in the diagram). The left channel measures the voltage across the load, and the right channel measures the voltage across a sense resistor that is in series with the load.
We can build a simple board to facilitate these connections. The schematic for that board appears as follows:

On the left we have an input, there's a sense resistor in the middle valued at 10 ohms, and on the right we have an output to the input we wish to measure.
The J3 connector goes to the right channel. That gives us the voltage across the sense resistor.
We also need to use a BNC T and pull a copy of the J2 signal and route that into the left + input of the QA401. The left - input is terminated.
And with this circuit, we have effectively re-created the speaker test diagram above except we don't need an amp to drive the load AND we are measuring the voltage single-ended (because we're only measuring one side of the QA470 input).
And with this setup we can use the following setup parameters for the speaker impedance plugin:

Note we've specified a 10 ohm sense resistor, and we're using a level (-20 dBV) that is at the higher end of the expected input range to ensure we are minimizing the noise in our measurement.
When we run this, we see the two traces on the QA401 display:

The yellow trace (left channel) is the voltage across the load at the various frequencies. The red trace (right channel) is the voltage across the resistor at the various frequencies. This plot was done with the phantom power disabled.
At 1 kHz, we can see there was about -20 dBV across the load, which is 100 mV. And we can see there was about -70 dBV (316 uV) across the 10 ohm sense resistor. 316 uV across a 10 ohm resistor means 31.6uA was flowing through that resistor. And knowing 100 mV across the load caused 31.6uA to flow, we can know the resistance at that frequency was 3.16k ohms.
The plug-in will compute all of this for us automatically. Below, a plot was run with the phantom power enabled and disabled, and the results plotted on the same graph:

We can see in the plot above that with phantom disabled, the impedance at 1K is about 3K ohms, very close to what we eyeballed off the raw plots.
And we can see with the phantom enabled, the impedance at 1 kHz is about 2450 ohms, a bit lower than the 2600 ohms we eyeballed above.
Summary
This post showed the QA401 speaker impedance plug-in can also be used to measure the input impedance of networks that are more challenging and not readily analyzed with a piece of scrap paper and calculator.
There are a few points to keep in mind: First, the sense resistor should be large enough so that you are seeing sufficient signal across the current sense resistor. In the plots above, the 10 ohm sense yielded signal at -70 dBV when measured. That is a bit on the low side, and a 20 or even 100 ohm might have been preferred to ensure a stronger signal. But noise wasn't an issue in the measurement so the 10 ohm was fine. But a circuit with a higher input Z might need a larger sense resistor.
Next, if you are looking to measure higher input impedances, don't forget the QA401 input Z is 100K, and thus you might want to consider a high-Z buffer to ensure the QA401 input impedance isn't compromising the measurement.
If you liked the post you just read, please consider signing up for our mailing list at the bottom of the page.
You can discuss this post on the forum here.
