
Automating EQ Tests using Masks
Release 1.79 is the latest release of the Q401 application (located here) and release 0.981 is the latest release of Tractor (located here). The QA401 application is the audio testing application, and Tractor is a companion program to the QA401 application. The applications work together: The Tractor application handles the high level scripting and test sequencing, and the QA401 application makes the measurements. You can read more about Tractor here. But the short summary is that if you need to validate a product in production, and you want to be able to script the tests yourself without writing any code, and then save the test results to a cloud database--then Tractor is the tool you want.
The last few releases of both of these applications have focused on integrating the notion of test masks into the test flow. Normally, when testing with tones, engineering might specify "The gain at 1 KHz needs to be 6 dB, +/- 0.5 dB." That is a very clear spec to code for. But when you are looking at a range of frequencies, how do you specify those? The answer is you use a mask. A mask is simply a list of amplitudes and frequencies. If the measured value is above or below the specified values at a given frequency, then the test fails. You can read more about masks here.
Today, we're going to automate the testing of an equalizer. Specifically, a Behringer Ultragraph Pro. This is a 2 channel 15-band EQ. And for the measurements today, we're only looking at the EQ functionality and we'll only look at the left channel. The challenge here is to create some automated tests to verify the EQ is functioning as expected. This must ensure the pots are connected correctly and deliver the expected range. The aim is to show how to create tests running from Tractor that will give us confidence the EQ that is leaving the factory is working as expected. Of course, in actual production you'd likely want to test even more details.

Setting up the QA401
Before we start with Tractor, let's make some simple measurements to familiarize ourselves with the EQ.
As a first step, it's always good to start with the QA401 in a known state. This will ensure settings from your previous measurement sessions aren't still lurking about. For this, from the QA401 application file menu, select File->Reset Startup Defaults.
Before connecting the QA401, it's also good to start with a QA401 measurement alone in loopback to re-familiarize yourself with the QA401 performance at the expected measurement levels. All we need to do to make this measurement using the defaults we just set is to enable Gen1. And then run, and add a few markers to the peaks by clicking above them.

From the above, we can see the noise + distortion is about -109, the THD is around -111 dB, the 2H and 3H are better than -114 dB and the gain is 0 dB.
Now, connect the QA401 to the EQ. We're making single-ended measurements today on just the left channel. We've selected 6 dB max input on the EQ, disabled feedback correction, set the gain knob to midpoint and disabled low-cut. Now the plot with the EQ in the loop appears as follows:

We can see the noise + distortion has risen from -108.8 to -98--about a 10 dB degradation. And we can see the THD has dropped from -111.8 to -107.1. The gain is relatively unchanged, and the levels of the 2H and 3H have dropped a few dB. We can also see there's a bit of 60 Hz present. But overall, this is a solid performing device. Quite a bit noisier than the QA401, but still very, very good.
Now would be a good time to make a measurement with the knob EQ gain knob at max and minimum. From that, we can read from the display that at max the EQ has a gain of 14.6 dB, and at min the EQ has a gain of -15.2 dB.
Next, let's switch to the frequency response mode. By pressing CTRL+click on the FR button, we bring up the context menu. The only change we'll make here is to select the chirp stimulus to be -10 dBV:

To clear the markers we previously set, just press D or right click in the display window and select Delete All Markers. Now we can look at the display and see the frequency response of the EQ:

The spectrum is the yellow line at roughly -10 dBV. And it's ruler flat from 20 to 20 kHz, which is what we'd expect. Let's adjust the Y axis using the Axis Setting knobs in the control region of the QA401 application:
Now we can better see the response with the Y axis ranging from -20 to 0:

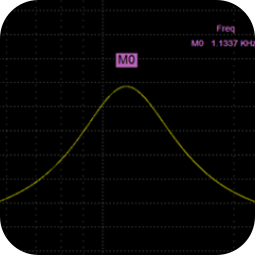
Now, on the front panel of the EQ, push the 1 kHz slider to the top as shown:

We can now add another marker and see the changing response in the QA401 display. After adding a new marker, we see the peak is at 1.13 kHz, and that the gain is about + 6 dB. Poking around some more, it's easy to see every slide has about +/- 6 dB of boost or cut. It's a bit curious the 1 kHz isn't precisely centered at 1 kHz, but it doesn't matter too much.

At this stage, we know a lot about the EQ, and we're ready to build some masks for Tractor. When we test the EQ, we're going to do 3 runs: The first will test the EQ with the sliders all flat (image 1), and then with alternately sliders set high/low (image 2), and then with alternating sliders set low/high (image 3). These will appear as follows:

This will exercise just about every test combination we might expect. Of course, there's always a possibility that a slider might have a dead spot and this test wouldn't find that. But knowing whether or not that is a legitimate concern is something you might know after building thousands of units. For now, we'll assume the 3 tests above will give us the coverage we need.
Building the Masks
We build the masks from inside the QA401 application. And to do so, we need to do several runs at each position to build some statistical validity. We'll run the AMP FreqResponseChirp plugin 3 times with the sliders in the positions shown above (9 runs total). After 3 runs of each configuration, we'll export the resulting mask.
To start, we center all the sliders, and then run the plugin:

After running the plugin 3 times for the flat setting, and adding all traces to the same graph, and then adding the default mask (Math->Add or Edit Default Mask). It's hard to see in the plot below, but there are 3 runs in blue. They just all overlap precisely (the mask limits are in the black). Ideally, we'd be able to do 3 or more runs using different units.

We can tweak the mask using the edit dialog. But for now, let's accept it as is and export the mask using the Traces->Export Mask option in the Graph. Export the mask as "Behringer Flat" or similar. You can then close the graph.
Next, repeat the process for the EQ settings in the alternating high/low (image 2 above). That looks as follows. They look a bit wild, but remember the EQ settings look a bit wild too: The measurement is following the settings.

And finally, again for the sliders set alternating low/high:

Now, with the sliders left in the alternating hi/low position, we can load the mask into the FR context menu as shown. We're doing this just as a quick sanity check.

And when we return to the QA401 main screen we see the mask and the measured data together, as well as a pass/fail indicator if all the spectrum fits inside the mask:

If we move any of the sliders on the EQ by more than 0.5 dB, then the display changes as follows:

Using Masks in Tractor
Everything above has been taking place in the QA401 application. Next, we're going to switch to Tractor and use the masks we just generated to create some tests.
Launch Tractor and add a new test:

Select the Level/Gain test filter, and add the test call FreqResponseA01. This test will use a chirp and a mask together to determine pass/fail.

You need to change 4 defaults: Change the Test Name to FreqResponseLoHi, unselect "Measure Right Channel" (since we're measuring the left channel only), change the level to -10 dBV (which is the level we used to create the masks), and click the browse button to load the LoHi mask file you previously created above.

Click OK to save the changes you made, and then you are able to Run the test:

When the Tractor Test Tasks window is displayed, click the start button

At this point, the Tractor app will start driving the QA401 application. After some activity, you should see the following. Note the QA401 application in the back has made the measurement, and we can see the name of the test was automatically inserted as the title. A screenshot of this measurement was also saved to the measurement log (which can be opened in your browser using the Tools->Open Log in Browser menu in Tractor). This single test ran, and it took just 1.8 seconds to cover the entire spectrum. Swept sine aka chirp tests are very fast.

The Final Test
At this point, the basic structure has been demonstrated. We can repeat it a few times to build tests looking at flat, HiLo and LoHi.
For the final test, let's make the following test plan:
1) Instruct the operator to set sliders flat
2) Measure gain with gain knob centered an sliders flat and compare to mask
3) Instruct operator to to set sliders HiLo
4) Measure gain with gain knob centered and sliders set HiLo and compare to mask
5) Instruct operator to set sliders LoHi
6) Measure gain with gain knob centered and sliders set LoHi and compare to mask
The video of the final sequence is shown below:
Summary
The new features in the last few releases of the QA401 application and Tractor should dramatically speed your workflow when analyzing complex response curves. Using masks, you can specify expected responses, and those can be verified with a quick ~1 second sweep. And all of this can be quickly automated under Tractor.
Related:
Quickly Characterizing A Tone Knob Using Exponential Sweeps
Like what you just read? Join our mailing list at the bottom of the page.