
Introducing the QA490
This week we begin shipping the QA490, which is a companion product for the QA401. The QA490 is for those that need to compare In-ear Monitors (IEMs) to "golden" units. In other words, the QA490 is for making relative measurements during manufacturing to ensure the headphones you are testing match reasonably well to a set of golden units that you have fully quantified in an acoustic chamber using industry-standard testing hardware (which is usually much too expensive to put on a manufacturing line). Similarly, if you are responsible for managing the IEMs for performers, and need a way to ensure the performance of the artist's IEMs for the duration of the tour, the QA490 can help there too by identifying shifts in performance that might be related to wax build-up, damaged drivers, etc.
In short, the QA490 makes it easy to compare IEMs. But the QA490 cannot answer definitively what the headphone sensitivity is at, say, 10 kHz. That's because the standard for doing so is somewhat arbitrary, and tightly tied to various manufacturer's solutions. We'll discuss that in more detail below.
The QA490 Front Panel
The front panel of the QA490 is shown below.

The LINK LED indicates if the QA490 is connected to the PC and processing commands over USB.
The HI GAIN LED indicates if the QA490 is in high-gain mode. Normally, the QA490 offers a gain of 0 dB, which is suitable for driving most lower-impedance headphones. For headphones with an impedance greater than 100 ohms or so, the high-gain mode will give an extra 12 dB of gain on the input signal. This ensures you can easily drive even 600 ohm headphones to the 25 or 30 mW level with input levels from the driving equipment that are around 1-2 dBV or so. Since the QA401 maximum output is around +6 dBV, this makes it easy to measure high-impedance IEMs and higher power levels. Currently, most high-impedance IEMs are coming in around 150 ohms or so--not quite as high as the over-the-ear headhones. But the drive challenges are still there.
The Z LED indicates the QA490 is in impedance measurement mode. That will be covered in more detail below.
To the right of the LEDs are the ear cups and 1/4" TRS output. The ear cups are where the IEMs are inserted.
To the right of the ear cups are the inputs. These are signals from the QA401. And to the right of the inputs are the outputs. These BNC connectors go back to the QA401.
QA490 Block Diagram
The block diagram for the QA490 is shown below.

There are two paths to consider. The upper half of the drawing shows the path of the audio input, flowing through the headphone power amp (OPA1622), and finally to the 1/4" front-panel 1/4" TRS. Notice the OPA1622 amps have switchable gain (0 or 12 dB, provided via a relay) and are followed by current sensors. The current sensors are needed to measure the impedance. During normal operation, the current sense resistor is bypassed, ensuring you get the full drive capability (>+/- 100 mA) of the OPA1622. When in current sense mode, a 0.5 ohm series R is switched into the path, along with a difference amp with a gain of 20. Combined, this gives an effective output Z of 10 ohms, but only burdens the output with the 0.5 ohm sense resistor. This ensures that while measuring the impedance you are still able drive low impedance IEMs without much drop across the current sense resistor.
In the normal mode of operation (Z LED is off), the output from the front panel is the signal from the MEMS mics. There are two MEMS mics (one for left, one for right), each positioned on the PCB at the base of the front ear cups.
The structure of each ear cup appears as follows (cross section shown, with the IEMs being inserted from the right side of the drawing). Note that the IEM is inserted into a 10.5mm diameter cup. An acoustic channel, roughly 12mm in length and 3 mm in diameter, delivers the sound from the IEM down to the MEMS mic. The MEMS mic is shown in red atop the green PCB, with the mic port centered in the channel.

If you are familiar with the evolution of acoustic couplers, then you'll quickly realize this looks nothing like the IEC '318, IEC '711 or any of the other standards that have emerged to model human hearing. All of these couplers have different goals in terms of what they are simulating. And even among each coupler standard there are huge variations that can be seen if you change a dimension just a bit. And since human ear canals can vary in length by 30-50%, it should be pretty clear this isn't an exact science. What might give a flat response on one human doesn't on another.
A good drawing of the ear with dimensions and some crude statistics is located HERE. A typical IEM will be inserted about 10 mm into the ear canal. Thus, the coupler above, with a 12 mm path length mimics a 22mm canal length.
Now, it might seem like it would make a lot of sense to try and exactly replicate the ear dimensions. But then you'd need to consider the material, the fact that there's a drum at one end, and on and on. In the end, while it could be done, it could only be done for a single person. But what that person hears is nothing like what the next person hears--similar, yes, but not the same. So there's a compromise that must always be made.
As stated at the top of this post, the aim isn't a perfect absolute measurement. Instead, the aim is a very repeatable relative measurement across a certain frequency range so that two hopefully identical IEMs can be compared. And if they appear nearly identical in the measurements, then we can assume the IEM that was questionable (aka the DUT) was manufactured correctly.
Below we'll look at a few different areas:
Sensitivity: This is the SPL output from the IEM at a specific frequency (usually 1 kHz). This can be readily estimated.
Frequency Response: This is the biggest wildcard, and the primary reason the QA490 is for looking at relative (instead of absolute) performance.
Impedance: Because impedance doesn't require an acoustic measurement, there is no uncertainty with this measurement.
IEM Isolation and Noise Cancellation: This is a measure of how much ambient noise is reduced for the listener. It can occur passively (isolation) or actively (cancellation).
Sensitivity
The MEMS mics used on the QA490 are TDK/InvenSense ICS40619 top-port mics. The key specs on the mic are below, but keep in the mind the mic is used in a single-ended fashion, so the sensitivity is - 6 dB less than what is shown. The mics also have excellent matching: the +/-1 spec is worst case. The acoustic overload point is 132 dBSPL (A-weighted), and the dynamic range is 105 dB below the AOP (27 dBSPL)--this is the equivalent input noise. If you've had notions that MEMS mics were inferior, they are not. Their consistency and huge dynamic range are leading and also the way forward. Massive investment from the industry is flowing into MEMS as these mics are enabling much of the innovation you see in the smart assistant space. Moving forward, expect to see further refinement around noise, flatness and bandwidth coming.

From the spec above, we know that if we hit the mic with a 1 kHz 94 dBSPL tone in a free field that the mic will output -44 dBV on each output, 180 degrees out of phase (remember the QA490 uses a single output internally) and these combine to the rated -38 dBV figure above. The way the mic is being used in the QA490 isn't free space--it's in a confined tube, has no porting, and thus it's probably more like a pressure field. The upshot of the enclosed environment (eg. IEM coupled via tube to microphone) probably doesn't match the free-space measurements.
Shure SE215-CL
Let's make some first sensitivity measurements with a Shure SE215-CL headphones. These are modestly priced $99 headphones with a clear spec on sensitivity: 107 dB SPL/mW @ 1 kHz.

So, if we hit the headphones with precisely 1 mW, then that should result in a 107 dB SPL. The coupler path will exhibit some loss (or gain), and the mic will see the post-loss level and generate an output signal based on that. What we need to determine is what the loss the coupler looks like.
The process depends on us knowing the precise impedance of the headphones. The measured value is just over 16 ohms. The procedure for making that measurement is shown below.
Next, in the QA401 application we can specify the load impedance via the dBV context menu:

In the QA490 application, we want to adjust the routing so that we can monitor the voltage across the headphone's impedance. We do this by selecting the Left Z mode. In this mode, the routing inside the QA490 will be modified so that the left channel output is the voltage across the left channel (measured directly across the IEM), and the right channel will be the current flowing into the left channel of the IEM. When you are in this mode, the Z LED will be illuminated on the front panel to alert you this isn't the normal mode of operation.

We can then adjust the generator level until we see precisely 1 mW being delivered to the headphones (note below how clean the signal is--there's no distortion from the OPA1622. This is another clue that the signal you are looking at is the electrical signal and not the mic signal).

Now, we move back to the default routing (without changing any levels on the QA401):

The QA401 display is now showing the mic output level, and we can see that figure is 63.5 mVrms = -23.9 dBV. So, we know that when we drove a 1 mW/1 kHz tone into the headphones, the headphones emitted a tone that was 107 dBSPL (based on Shure specification), and the mic responded with an output that was -23.9 dBV, which is 20.1 dB above the -44 dBV @ 94 dBSPL sensitivity. This suggests the level seen by the mic is 94 + 20.1 = 114.1 dB.
 Now, at this point, we have a discrepancy to rationalize, and that value is about 114.1 - 107 dB = 7.1 dB--that is, it's 7.1 dB higher than we'd expect. Now, the Shure IEMs could be putting out more volume than expected (eg their sensitivity is higher than the spec). Modern manufacturing should probably have that down to +/- 2 dB or better. And the mic is spec'd to within +/- 1 dB. But, we also have a gain or loss from the coupler that isn't yet understood.
So, for now, let's note that it appears that 107 dBSPL generates -23.9 dBV. Which means that 94 dBSPL of IEM output would generate -36.9 dBV.
Repeating with FiiO FH1s
FiiO FH1s are well regarded IEMs with a rated sensitivity of 106 dBSPL/mW. The measured impedance of these headphones is 26.7 ohms. With 1 mW into the IEMs, the output is -23.7 dBV.
With the FiiO , it appears that 106 dBSPL generates -23.7 dBV. That is very close to the -23.9 dBV value measured above. This means 94 dBSPL would deliver -35.7 dBSPL.
So, the Shure are -36.9 dBV @ 94 dBSPL, and the FiiO are -35.7 dBV @ 94 dBSPL
If we split the difference, that gives a sensitivity of -36.3 dBV @ 94 dBSPL. Let's call it -36 dBV @ 94 dBSPL. This probably isn't broadly applicable to all IEMs. You will need to estimate for your IEMs them based on established acoustic measurement in your own lab.

Once we have a rough sensitivity established, we can make further readings in absolute dBSPL. If we specify an offset of -(94 - -36) = -130 dB, then we can read dBSPL directly from the display (the peak is at 106.3 dB SPL--if you use the dBR setting, you can change the scale to read dBSPL instead of dBV)

We can also run a stepped chirp response to see where the IEMs start to go into compression. In the test below, we're stepping from -30 dBV output to -4 dBV output, 2 dB per step. What we're looking for in the output plot is where the output no longer increases 2 dB. This will be shown by lines that begin to collapse upon each other.

And in the plot below, we can see around 125 dBSPL and at 2 kHz the output started going into compression:

Frequency Response
In the previous section, we used some measurements of some well specified IEMs to derive an approximate sensitivity for the QA490. We can do this at 1 kHz, because everything is well defined at 1 kHz.
Let's take a look now at repeatability of measurements. To do this, we're going to run a frequency response plot on 5 sets of "Adorer EM10 headphones", all new.
But before running the five different sets, let's take a look at the frequency response of the same EM10 IEM measured 6 times without re-fixturing between runs. As expected the repeatability is very good above 100 Hz. We can see some difference between left and right, however. This demonstrates a lower bound on frequency response measurements to keep in mind.

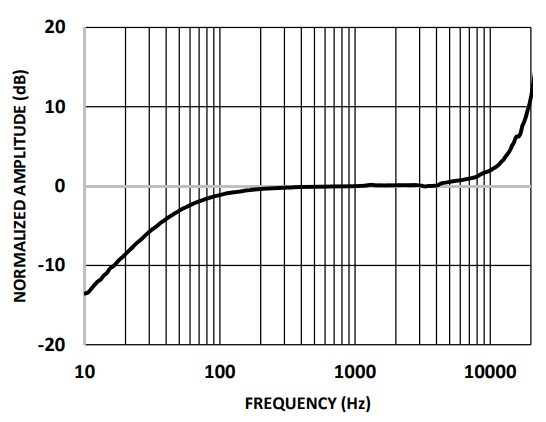
Now, at this stage, it's pretty clear the frequency response isn't flat. Why is that? Let's start by looking the frequency response of the ICS40619 MEMS mic. This is pretty typical for all smaller MEMS mics: At the low-end range there is a roll-off related to the internal volume of the MEMS package. In the high frequency range, there is a resonate peak. In bottom ported mics this resonate peak is generally higher due to the smaller resonances associated with the mechanical structure.
Now, the good news is that the MEMs response is very consistent. But the shape of the MEMS response limits the un-corrected response of the mic to roughly 300 Hz to 8 kHz or so if your aim is uncorrected flatness..Later experiments will look at flattening the response curve through software (and this would also aim to correct resonances that are dependent on the mechanical coupler structure).
Getting back to the measured frequency response and using the same settings as above, let's make one measurement as fixtured, an then reverse the left and to see what changes. In the plot below, note that the variation is related to the IEMs and not the QA490 around mid-band. If the variation was related to the QA490, then you'd expect to see the reds (right channel) bunching together and the blues (left channel) bunching together. And in fact, you do see that happening up around 10 kHz.

Finally, let's take a look at 10 runs of the same IEM, just re-fixtured. That is, make a measurement, remove the IEMs from the earcups, replace the IEMs into the earcups, and then measure again. The goal here is to tease out how sensitive the measurements are to operator placement variation. There's a lot of variation at the low end, and we can see the right channel exhibits a lot of variation around 9 kHz. Let's zoom in a bit more:

Overall, the spread looks very tight from 500 Hz to 8 kHz or so. From this data, we could generate a mask to use as a pass/fail.

Now let's run 5 different sets of EM10 headphones. Here we start to see the manufacturing variations. Above, when the same headphone was run 10 times, note the spread at 1 kHz was around +/- 0.5 dB. In other words, no matter how you fixtured the headphone, the result was nearly the same at 1 kHz.

Zooming in on the above at 1 kHz, we can see more on the spread. The hottest sensitivity was about -39 dBV and the coolest was about -42 dBV. Adding some +/-4 sigma bars take the spread from -36 to -43.5, or about 7.5 dB, or +/- 3.75 dB. That's a barn door, and 4 sigma is a pretty weak quality gate. In short, we'd expect that out of 100 headphones, there's be large, audible difference between the units. No surprise, these are very low-cost headphones.

Frequency Response Takeway
The unique mechanical structure of the QA490 combined with the frequency response of the QA490's MEMS mics make it very hard to use the QA490 as a device for developing headphones. Instead, as noted above, it should be seen as a device for confirming two headphones match in terms of performance around a few key areas: Sensitivity, frequency response and impedance.
Measuring Impedance
To measure impedance, the HEAD Impedance plug-in can be used:

The options for this plug-in appear as follows. There's not much value in driving the IEMs too hard or too soft. If you drive too hard they may distort, and if you drive too softly the SNR of the measurement will result in a noisy measurement. Keep in mind that most headphones will be used around 80 to 100 dBSPL, so pick a drive value that falls at the higher end of that range. This will help minimize the impact of nearby sounds on the measurement quality.

The impedance plot of the Shure SE215 is shown below. These are 17 ohm headsets according to Shure.

A plot of 5 EM10's is shown below. These are rated as "16 ohms at 1 kHz".

Assessing Noise Isolation & Cancellation
Sure SE215
Noise isolation is the amount of noise a set of IEMs will block for the listener. This comes from simply plugging the ear canal. Noise isolation can be learned by playing a white or pink noise source on speakers, and looking at the difference in spectrum. Because these measurements are relative, the QA490 can help reveal the regions where isolation is working well.
In the plot below, you'll see two traces. The green trace is the ambient pickup of the pink noise source. The yellow plot is the with the SE215 inserted (and unpowered). You can see around 1 kHz there's about 15-20 dB of reduction, and around 4-5 kHz there's 30-40 dB of reduction. Shure indicates these IEM blocks "up to 37 dB" of external sound (no information is provided on the frequency), which is a true statement. The SE215 have foam tips, which provide a very good seal.

EM10
The EM10's don't spec the amount of isolation, and they have conventional silicone tips which provide less isolation than the foam tips generally.
In the plot below, you can see the EM10s provide perhaps 25 dB of isolation in a very narrow region around 2 kHz. Certainly not as good as the SE215 above.

Noise Cancelling: Amazon Echo Buds
Noise isolation is a passive process that is achieved by blocking outside sounds. Noise cancellation is an active process where DSP is used to counter whatever noise has leaked into the ear canal.
A plot of the Amazon Echo Buds is shown below. Most notable is that the reduction is closer to 20 dB, but it occurs across the entire band--from just under 200 Hz to over 10 kHz. This is a substantial improvement from the simple isolation above. The isolation wasn't able to reduce noise in the 100 to 1 kHz region, while active noise cancelling is very effective in that region.

The Echo Buds also support a pass through mode, which is shown below. This gives a ~10 dB boost in a slightly reduced telephony range (400 Hz to 2 kHz instead of 300 to 3 kHz).

Summary
The QA490 won't give you a definitive answer on the performance of your headphones. But it will give you a very fast, and very detailed comparison of the DUT IEMs to a set of golden IEMs.
If you are selling IEMs and you aren't doing an electro-acoustic test on everything you ship, why not?
If you are addicted to IEMs the way some are addicted to sneakers, or responsible for maintaining IEMs and you are wondering if the IEMs are working the way they did when they were first put into service, the QA490 combined with the QA401 can answer that question quickly.
PS. This post can be discussed on the forum at the link HERE.
If you liked the post you just read, please consider signing up for our mailing list at the bottom of the page.