
QA401 Release 1.70
Release 1.70 should be out this week and adds in a test plugin (Test Plugins-> Speaker Impedance) that makes it easy to measure the impedance of a speaker. Another plug-in was also added that makes it easy to sweep THD or THD+N versus power. Both are discussed in more detail below.
Speaker Impedance Measurements
Measuring the impedance of a speaker is fairly straight-forward: You play a tone into the speaker and measure the voltage across the speaker and the current into the speaker. The quotient of those two gives you the impedance. If you make complex measurements for each, then you can also learn the phase.
If you sweep a tone into a speaker, and measure the current during the sweep you can arrive at the impedance at every frequency. This plugin uses a chirp--a sweep from a very low frequency (around 2 Hz) to a very high frequency (around 22 KHz). The voltage across the speaker is measured, and the current across a sense resistor is a measured. The block diagram for the test setup is below:

From the diagram, notice that the output of the QA401 is directed into an audio amplifier, and that the output across the speaker is measured using the left channel of the QA401. The right channel is used to measure the current across a small sense resistor around 0.1 ohms.
You will need an amplifier for sure. If you try to drive a 4 ohm speaker directly from the QA401 it will severely load the output to the point that the measurement won't be relevant. The amp you use should be class AB, as Class D amps typically have a load dependency at the higher end that might cloud your measurements. A single-ended amp, where one terminal out of the amp is ground, is fine. And that means that you can go single-ended into the QA401. Just use a terminator on the L - input of the QA401.
The amplifier doesn't need to be a beast. Just a watt or two is all you need usually. The key to making more accurate measurements is ensuring you are hitting the QA401 with a signal that is sufficiently out of the noise for the current measurement, but not so strong on the speaker measurement that you need to enable the attenuator.
The UI for the speaker measurement plug-in is shown below:

The settings above are using an upcoming product called the QA460. It's an amp with a few watts of output, bandwidth out to 70 KHz or so, and ruler flat for just about any load you might throw at it. It has a 20 dB gain stage provided by an OPA1611, a built-in fixed 20 dB attenuator on the speaker output, and a built-in 0.1 ohm series sense resistor with diff out. If you are doing a measurement as precisely shown in the block diagram, then your external gain would be 0 dB--that's +20 dB from the OPA1611, and -20 dB from the output attenuator.
Note that the output level will be the level you would measure coming out of the QA401 with a DVM. That is, if you sweeped slowly, your DVM would measure the same level as the tone swept. But if you look at the FFTs below, that isn't the case, Why does every frequency seem to be a different amplitude?
The reason the level in the plots below look so small is because the FFT saw all frequencies and averaged accordingly: The displayed amplitude is a function of the dwell time and the FFT size. Lower tones are played or longer periods since it's a log chirp, and higher tones are played for shorter periods.
After you have made your first speaker impedance measurement, take a look at the traces captured to see if you are optimally measuring things:

There are a few problems in the capture above. First, notice the current measurement in red is wide and fuzzy. You can see it starts to get noisy around 3 KHz and gets worse from there. That noise will cause noise issues in your impedance measurement because this signal is the denominator in the impedance equation.
Why was this capture so poor? First, the FFT size was too small. A small FFT requires the chirp to sweep very quickly, and thus the energy at each frequency is lower. So, the first rule is that we want a very large FFT size.
A second rule is that you want to use the lower sample rates. Slower sample rates (eg 48 versus 192) ensure you dwell on each frequency longer, further improving the accuracy because you increase the energy per Hz
Finally, in the measurement above, the attenuator was active. That raised the noise floor of the measurement.
Let's try again with some smarter settings:

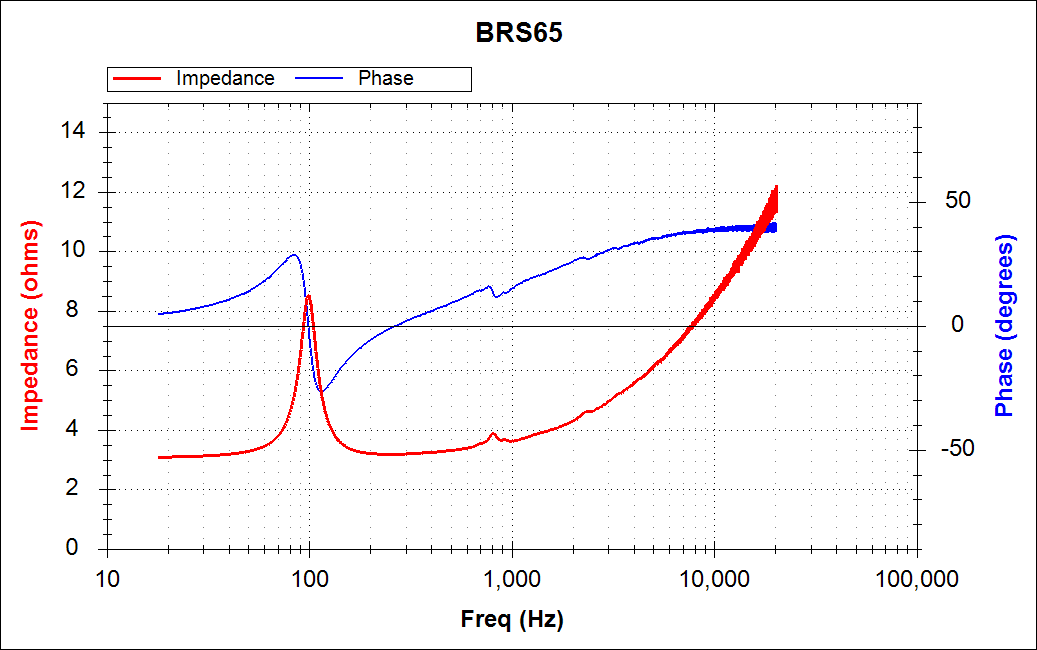
Better! Above we see thin, crisp traces beginning around 20 to 30 Hz and extending up to 20 KHz. And that let's use get a clean plot of both impedance and phase:

Right click on the graph to reveal more display options, including the ability to read off data points directly. In the future, this plug-in could be extended to calculate and print out TS parameters.
THD versus Output Power
Another plug-in let's you sweep THD versus power. We've had two-plugins shipping for a long time that will sweep THD (or THD+N) versus amplitude and/or frequency. But this plug-in makes it a snap to characterize a power amplifier into a particular load.
The UI for this plug-in is shown below:

Here, you specify a fixed frequency for all measurements, and a range of levels out of the QA401 you'd like to sweep. The plug-in will measure the input level at each output level, and compute the power. And then present that info in a graph as shown below:

Summary
We'll continue to evolve the various plugins. A question we have received is "why plugins when there is Tractor (or vice versa)?" The answer is that Tractor will be the platform for developing production tests, and in-app plug-ins (such as above) will be the platform for building more complex engineering tests.
PS. In the install directory there's a folder called 'API' that has a zip file of the source code for the THD versus Power DLL we covered above. Interested in writing a DLL to make your own custom measurements? We'd be happy to help. Just contact us at the support alias.
Like what you just read? Join our mailing list at the bottom of the page.